Someone was asking in a Facebook WordPress group whether loading extra stylesheets would reduce website performance. That got me thinking about conducting a test to determine if loading multiple extra stylesheet files would noticeably increase website load time, and if so then by how much. I’ve always pondered on whether combining a large number of separate stylesheet files into one single file, rather than multiple smaller files, would have any significant benefit on website performance.
Obviously the byte size of external text files, whether they be CSS stylesheets or javascript/jquery files, will increase page byte size potentially increasing load time, and should of course always be minified for best performance; But is there any significant benefit in reducing the number of files loaded when the combined byte size is equivalent?
The expectation might be that loading external files, such as CSS stylesheet files, is a server-side process and therefore because servers tend to be fast any effect on performance should be negligible. However I thought it was time to put this expectation to the test!
Test Conditions
The testing was unscientific and rather adhoc! The test tool chosen was GTmetrix.com configured to test from a London based server, the test website was running on WordPress v6.0.1 with the lightweight Astra Theme v3.9.1, together with their ‘Web Design Agency’ Starter Template, running on an OpenLiteSpeed webserver.
We started by testing the Starter Template without adding any extra files and recorded the data associated with Core Web Vitals (CWV) and noted that it was making 24 requests. From this base point we added markup in the header (using WPCode’s Insert Headers and Footers + Custom Code Snippets plugin) to load an additional 6 files to make a total of 30 requests. In each file we added the same minimal CSS which happened to be the following 16 bytes of code: body{margin: 0;}
We retested the CWV metrics at 30 requests, then incrementally added 10 files/requests and retested at each increment with 3 tests per increment. Before testing the Asset CleanUp cache and LiteSpeed Cache were both cleared. Most of the performance tests were conducted between 9am and midday GMT. The data was tabulated in an MS Excel spreadsheet and then plotted in charts as seen in the results below.
Test Results
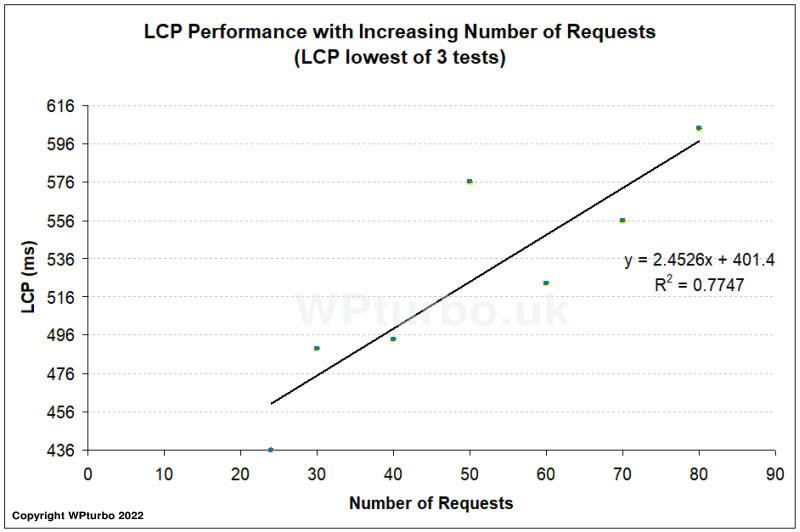
The chart below shows seven data points, one for each request increment with LCP being the lowest obtained from 3 x GTmetrix tests; The first data point, LCP 436ms at 24 requests, is for the Astra Starter Template without any additional files. Added to the scatter plot is a trendline (linear regression line) as determined by the MS Excel software. The trendline equation and R-squared value is shown below the trendline on the right. The R-squared value seems to indicate a reasonably high correlation at 0.7747 or about 77%.
If we subtract the base Starter Template LCP time of 436ms from the LCP times to start the Y-axis at zero, and start the X-axis at zero file additions, then we can clearly analyse the additional load time attributed just to the file additions. At the same time if we change the trendline from linear to polynomial (a best fit curve) then we get a closer correlation with an R-squared value of 0.7924 or about 79%. However the Y-axis then starts above zero which doesn’t make any sense for no extra requests, so if we set the Y-axis intercept to zero we see the results in the chart below with an R-squared value of 0.7751 or about 78% rounded up.
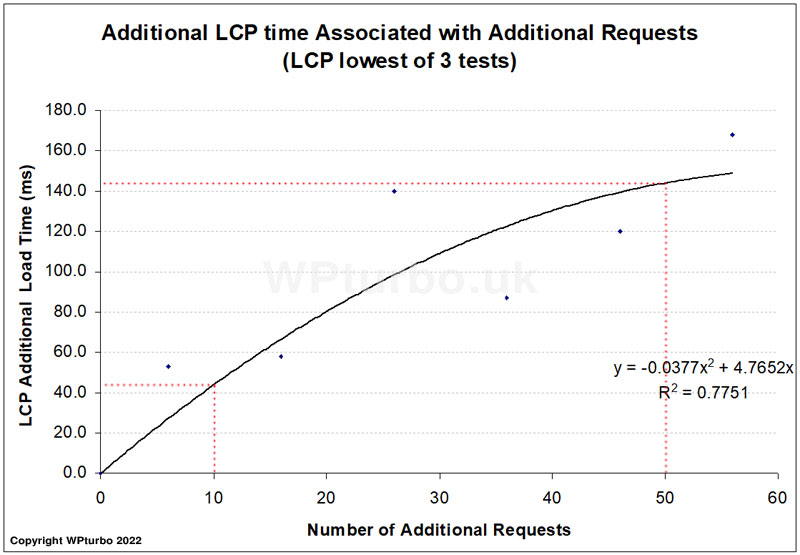
If we input the number of additional requests as 10 and 50 into the line’s equation y = -0.0377x2 + 4.7652x we get 44ms and 144ms respectively, as depicted by the red dotted lines on the chart. So for 10 extra stylesheet files we might expect an extra page load time of around 44ms, and for 50 extra files around 144ms, based on the Web Design Agency Astra Starter Template that we used for testing; That’s ranging from approximately 2.9ms to 4.4ms per request depending on the number of extra requests. Using the line’s equation, one extra request would add a 4.7ms overhead to the LCP time according to this model.
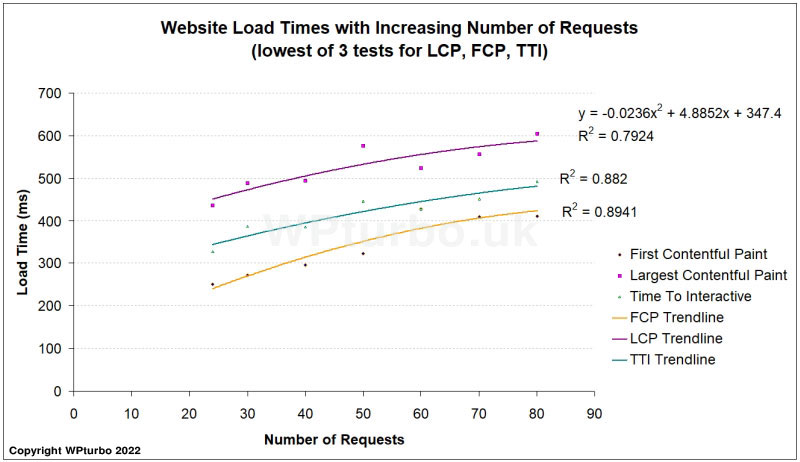
Just for interest, adding FCP (First Contentful Paint) and TTI (Time To Interactive) to the first chart with polynomial lines we get the results shown below.
Conclusion
These website speed tests were intended to assess the load time overhead of loading multiple external files, particularly stylesheet files. We need to do many more tests to see whether the data reliably matches the above trendlines using the R-squared values to assess the level of correlation, and therefore whether the graphs really provide good statistical models.
Based on the limited number of tests made, the data available suggests that maybe the extra load time is not directly proportional to the number of extra requests but instead perhaps the average extra load time reduces with quantity. I suspect that it does but maybe not as much as our chart indicates, we need more data points to be sure. For smaller numbers of additional files the chart suggests that the extra load time might be around 4ms per request, based on our model using Astra’s Web Design Agency Starter Template; On that basis, for those trying to achieve optimum performance, it would be worth combining stylesheets and javascript files rather than loading separate files. Often each WordPress plugin will include it’s own stylesheet and therefore add to the number of http requests, so that’s a consideration for LCP times.
There is an obvious flaw in this test though! Each external file contained 16Bytes of CSS code, so for the test with 6 extra CSS files, making a total of 30 requests, each of the 6 files should have contained 149Bytes each instead of 16B to be comparable byte-wise to the test with 56 extra files (80 total requests) which would total 896B. So the difference in page size between the test with 6 extra files compared to 56 extra files would be 800B ((56×16) – (6×16)). Hey that’s less than 1KB difference, I’m going to assume the flaw is insignificant! Can you see any other flaws in this model? Please comment below.
Our test website was installed with the LiteSpeed Cache plugin which was set to minify and combine CSS files, so perhaps the same tests should be also be performed with ‘CSS Combine’ set to ‘Off’ and compared.
From our experience the LiteSpeed Cache plugin significantly improves performance without the need for an expensive CDN (Content Delivery Network). CDN services are very useful when the target audience is Worldwide, however our low LCP times demonstrate that, if your target audience is based in the country where the hosting server is located, fast loading times can be achieved without using an expensive monthly CDN subscription service. Typically the faster a page loads the lower the bounce rate – see our previous blog article How fast should my website load in 2022?
Finally if you’re looking for a lightweight fast loading WordPress theme you can get Astra’s latest theme by clicking the link below. Once you’ve installed the Astra Theme, then install their Starter Templates plugin and follow instructions.